Statistics and the Liberal Arts – A Guide to Studying Statistics as Part of a Liberal Studies Education

Dice demonstrating statistics

Back when humans were hunting woolly mammoths and avoiding saber-toothed tigers, we were also rolling astragalomancy, the predecessors of dice.

Games of chance date back at least 5,000 years to Mesopotamia. Wherever people have been and wherever they are today, some form of gambling based on odds has been part of the culture. The concept of statistics is innately human, which is why it fits into a liberal arts context so well.

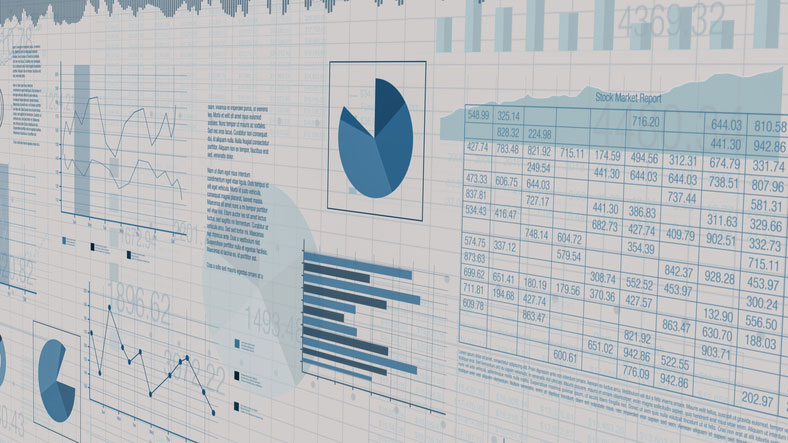
Statistics is a way for understanding the cause-and-effect relationships between everything in our world. It shows how everything is and is not related. And though it might be surprising to hear, the zettabytes of data that comes pouring out our daily activity in the digital age has made it one of the fastest growing career fields in the world.

Studying statistics as part of a broader liberal arts curriculum will make the arcane Gaussian and Bayesian concepts part of your repertoire of knowledge, priming you for the kind of roles in data science that require a touch of humanity in order to put all that information to good use.

Everything from medicine to political elections to forecasting deadly weather events will depend on the prowess of the best statisticians. Interdisciplinary fields like these demand graduates with an interdisciplinary education that’s steeped in the liberal arts.

Statistics graphs and charts

What is Statistics? – The Basic Components of Applied Statistics

Statistics deals with everything that’s data-related:

Collecting data – this can include everything from receiving remote weather station telemetry and analyzing website traffic to going door-to-door to distribute the census

Analyzing data – this is the part where statisticians try to arrange data in ways that inform the way it’s interpreted

Interpreting data – this involves reading statistical models to form conclusions about predictive patterns

Visualizing data – data is featured in reports and plotted on graphs in illustrative ways to inform an audience

It all takes place through the language of mathematics. As a statistician you’ll become proficient in algebra, calculus, and linear algebra. You’ll likely also become familiar with a computer programming language like R, Python, or GGobi.

A Hockey Stick Trend Line for Jobs in Statistics

Server roomThe number of jobs for statisticians is projected to grow by 35% over the ten years leading up to 2030. Compare that to the 8% projected average projected job growth rate for all other fields, according to the US Department of Labor.

Collectively the following industry sectors employ half of all statisticians in the nation:

To enter the workforce, statisticians typically need a master’s degree, but there are plenty of entry-level positions where a bachelor’s degree will get your foot in the door. Career doors to tenured teaching positions and advancement in the private sector are often opened with an advanced doctoral degree.

Colleges, universities, and federal agencies place a premium on education that’s interdisciplinary in nature. Working in the healthcare and social assistance sectors requires the ability to effectively communicate with clients and colleagues from different cultural and socio-economic backgrounds, as do jobs in the scientific research field. These factors all help to explain why an education that emphasizes the liberal arts can be particularly helpful over both the short and long-term for a career in statistics.

2020 US Bureau of Labor Statistics job market trends for Statisticians is based on national data, not school-specific information. Conditions in your area may vary.

Statistics Courses Introduce a World of Fascinating Concepts

Courses in statistics are heavy on math and will also often incorporate language from computer programming. Classes cover topics like:

Bayesian inference and probability – the concept that probability can be assessed using reasonable expectations, and that as more data becomes available an expectation can be assessed more reasonably.

Linear regression – the analysis of independent and/or dependent variables and their relationship with a causal event (scalar) within model parameters that are established by sampled data.

Mosaic plots – a graphical way of presenting data visually for at least two qualitative variables.

Nonlinear regression – the causal event/scalar being assessed has a nonlinear relationship with at least one independent variable, like an exponential relationship.

Causal study – an experimental or observational study that analyzes the relationship between two variables and looks for any causality.

Gaussian distribution – also known as normal distribution or a bell curve, this is a symmetrical curve on a distribution graph whose apex represents the mean relationship between variables.

Interquartile range – the 50% midsection that comprises a Gaussian distribution.

Statistical Analysis Has More Influence in the World Than We Could Have Ever Imagined

Smart city connectedLooking to the future, the field of statistics is becoming increasingly important.

One of the hottest fields right now, which is having an enormous impact on everyone’s lives and will only become more significant in the future, is data science. Everything from influential social media algorithms to artificial intelligence to machine learning has data science at its heart, which is essentially statistics applied to massive amounts of data using computers.

“The world’s most valuable resource is no longer oil, but data”

A headline in The Economist back in 2017 heralded a landmark event: “The world’s most valuable resource is no longer oil, but data”. In 2018 it was revealed the consulting firm Cambridge Analytica improperly harvested political data from tens of millions of Facebook profiles in a move that some say led to the election of Donald Trump. Silicon Valley has used statistics to bring us into a new era where individuals have been transformed from being the consumer to being the product.

If it’s Free, You’re the Product

Today’s smartphones are data goldmines, or more aptly data oil fields, for statisticians. They gather millisecond-by-millisecond information on statistics like:

Any statistician will recognize that knowing this much data about an individual is invaluable for any company that has a product to sell; this maximizes the effectiveness of targeted advertising. One recent study shows that targeted advertising costs 62% less than traditional advertising yet generates three times as many leads.

Advertising is just one example of a significant sector where statistics are going to be increasingly relevant, but it’s far from the only one:

As computers are trained on human diseases through machine learning, AI programs will be able to diagnose some diseases better than doctors. In 2020 the journal Nature published a study on diagnosing breast cancer that found a computer program trained only on mammogram x-rays outperformed single doctors with access to the same mammograms and a patient’s entire medical history.

Complex predictions for systems that involve many variables like hurricanes, pandemics, tornadoes, and earthquakes will become more accurate as computing power is able to crunch statistics to run simulations with petabytes of data.

As computers become better at predicting the factors that determine and influence a person’s political preferences, elections in the future will be decided based on which candidate has the best computer software.

The future holds unforeseen challenges along with revolutionary developments in the field of statistics. These will change the way people live their daily lives: how they get medical treatment, who their policymakers are, and environmental safety in general.

Statistics is going to impact humanity down to its core, affecting everything from the arts to philosophy to religion. Statistics is a powerful tool and must be used for the benefit of humanity. This is why it’s so important to study statistics in a liberal arts context.